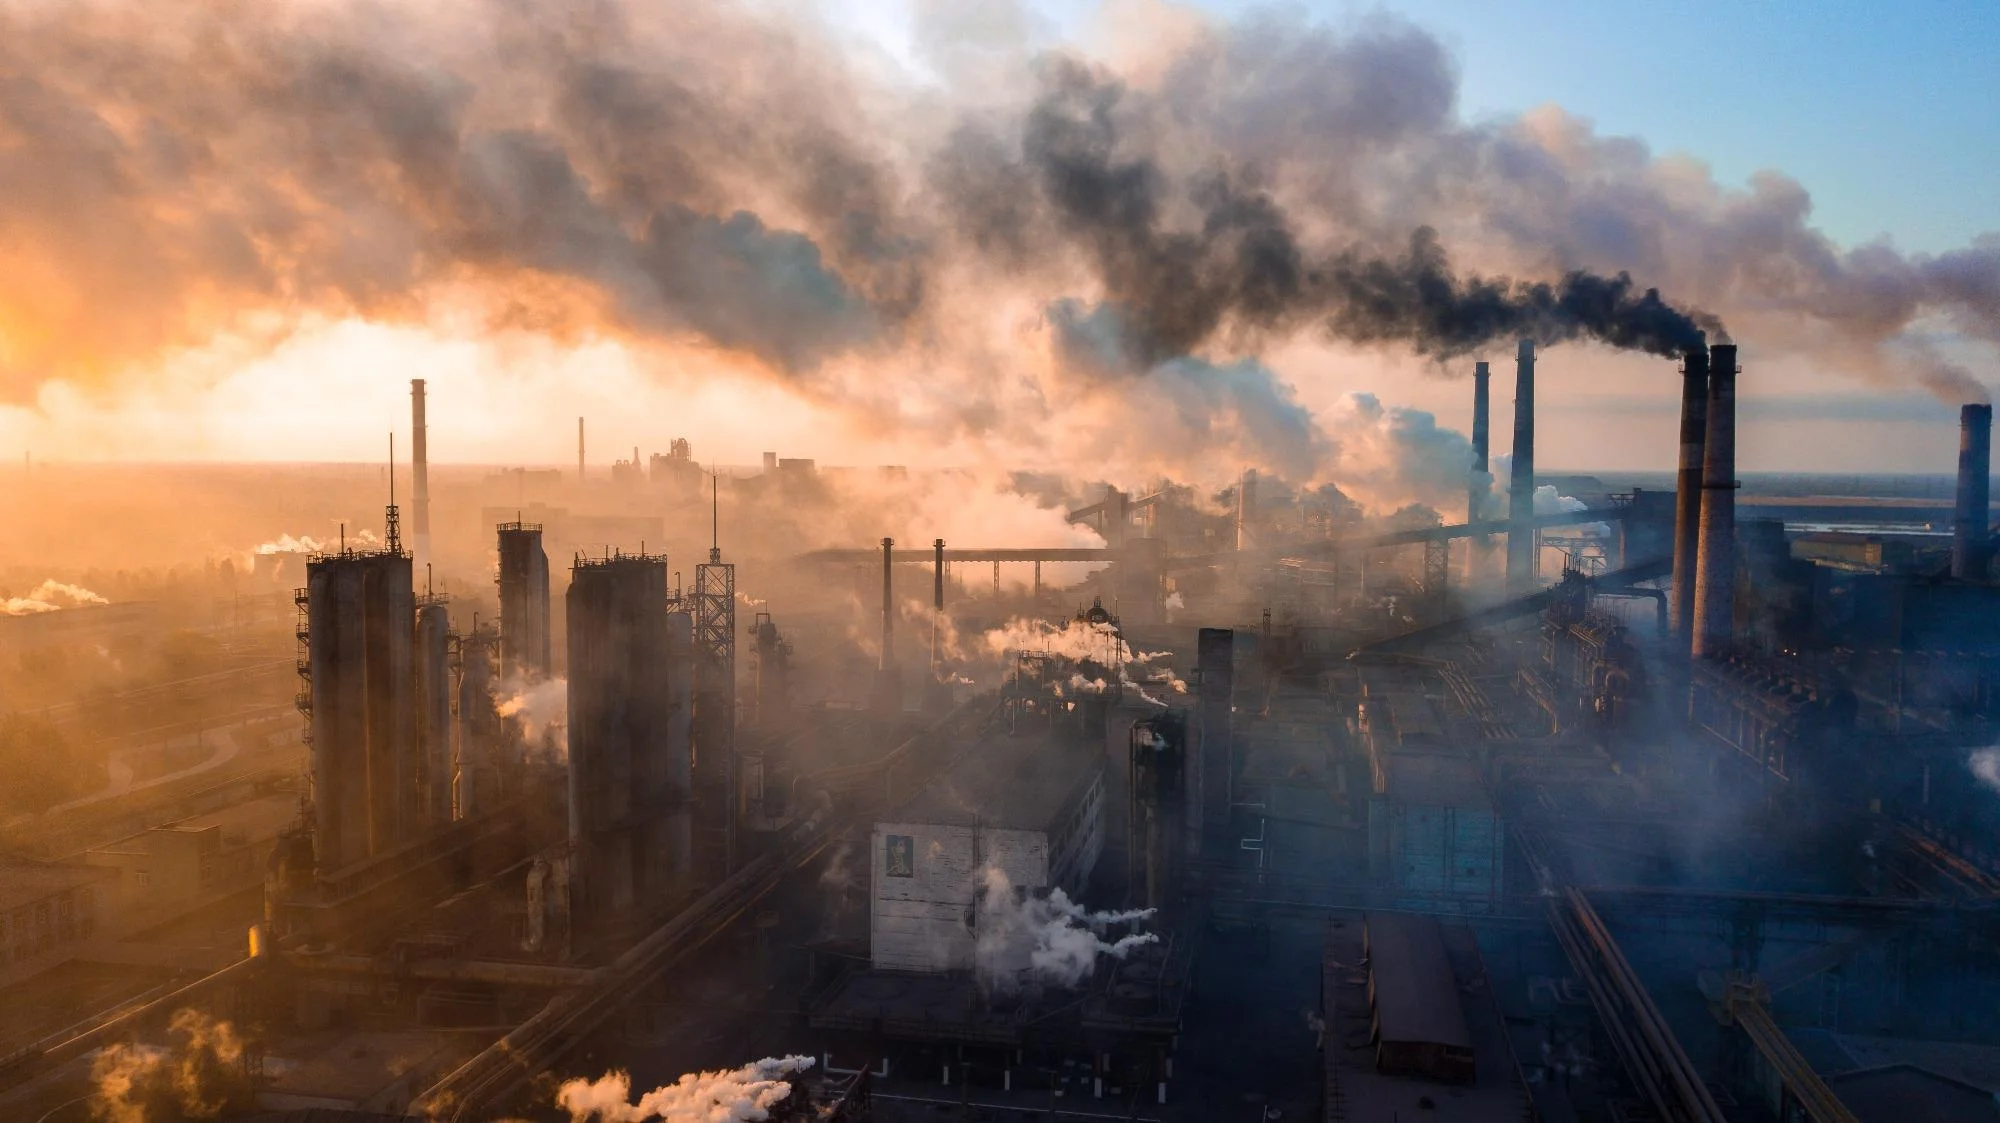
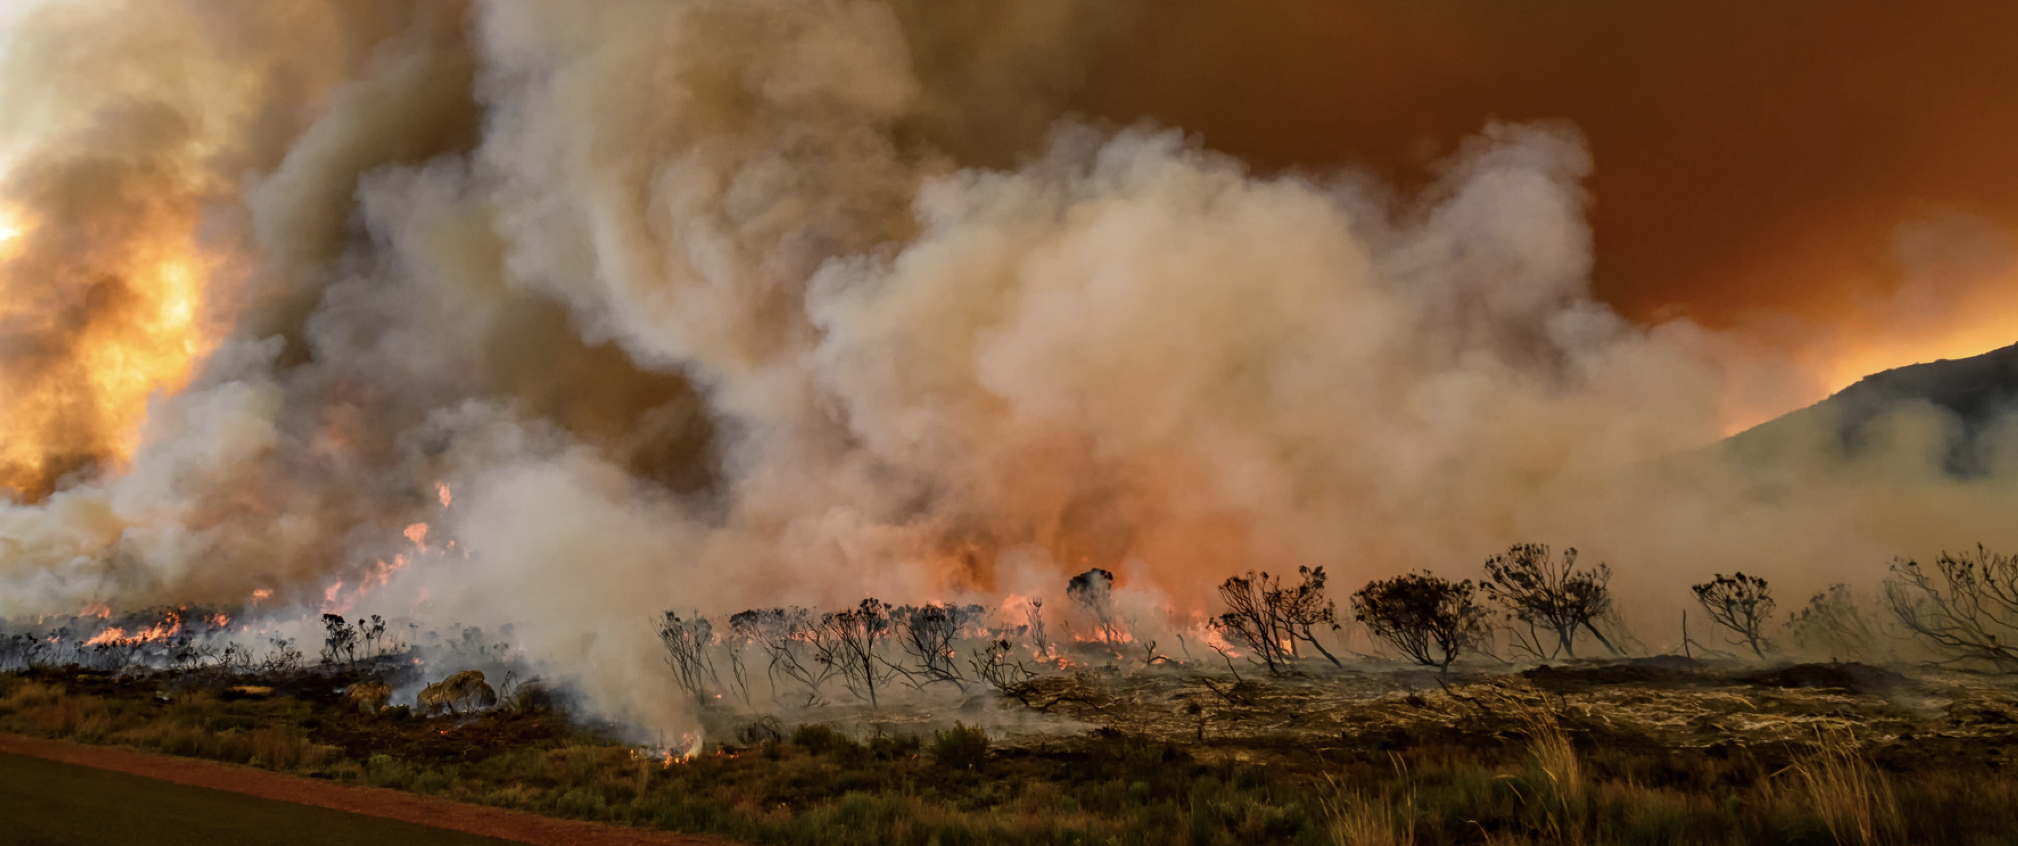
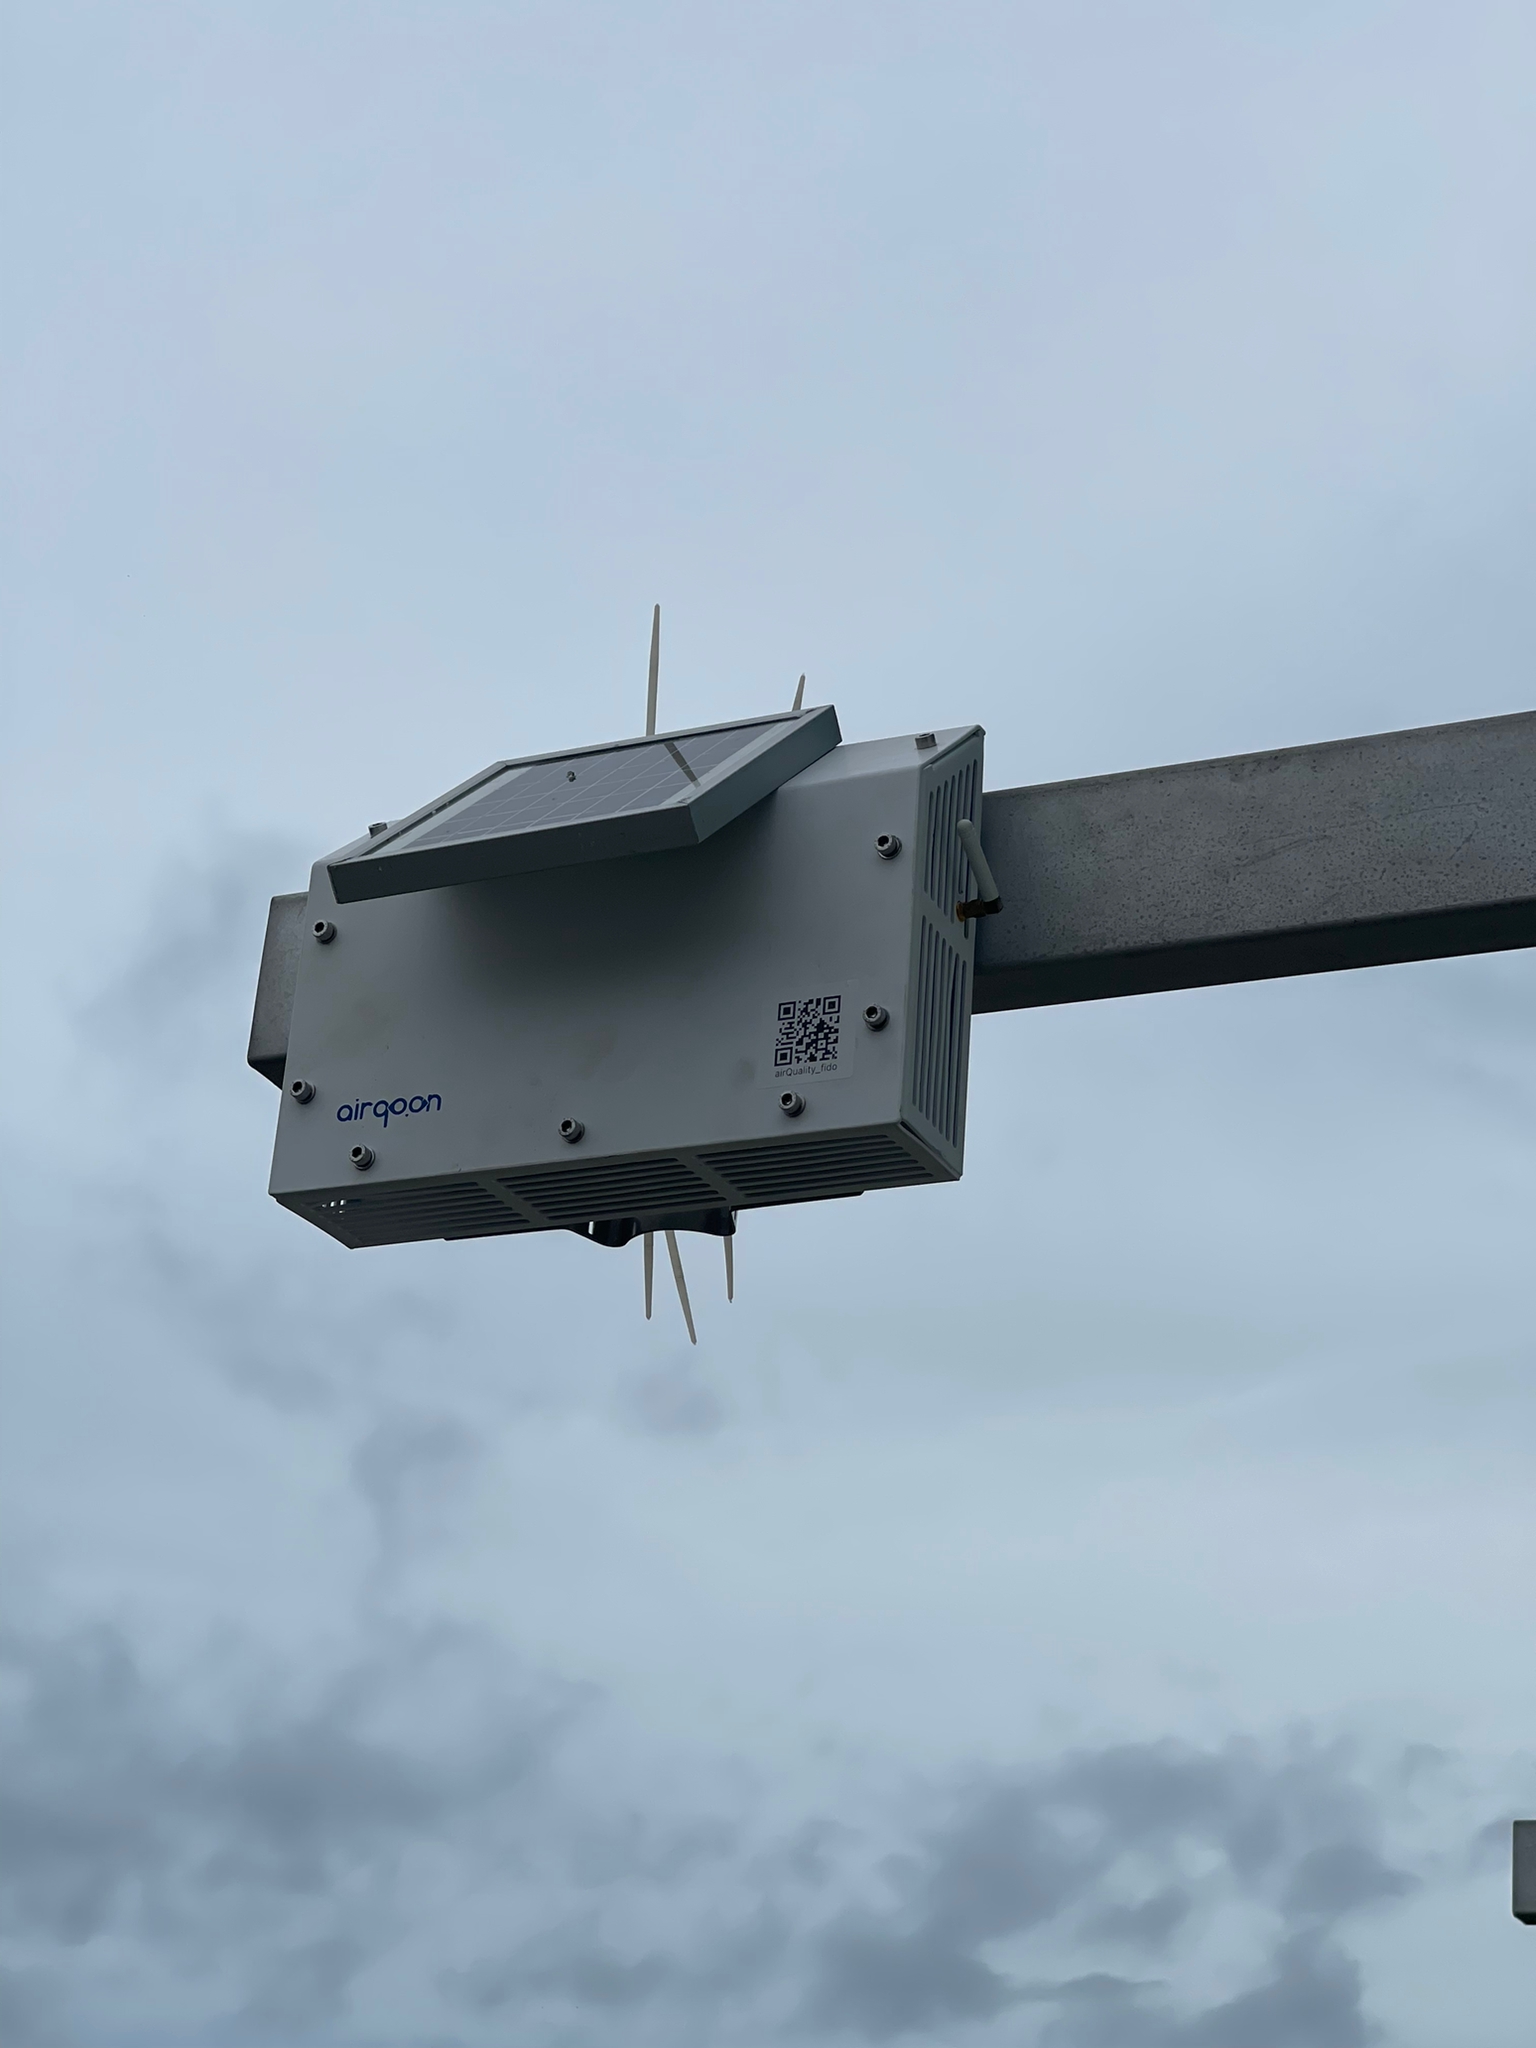
Air pollution is responsible for the degradation of ecosystems, increased health problems, and millions of premature deaths globally each year. According to WHO data, almost all (99%) of the global population breathes air that exceeds WHO guidelines and contains high levels of pollutants (WHO, 2022). Air pollution is an urgent environmental problem at the intersection of industry, transportation, fossil fuels, health, and social justice (Greenpeace, 2021). Creating air pollution mitigation strategies can increase potential greenhouse gas (GHG) reductions and improve health.
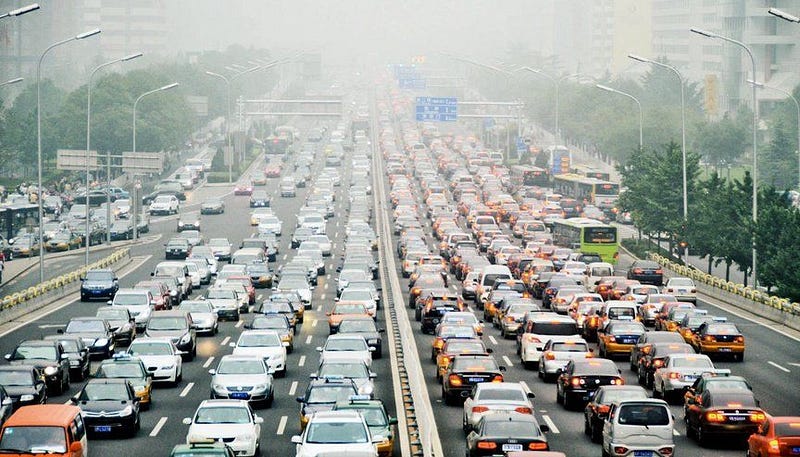
Cities account for 78% of the world’s energy and 60% of greenhouse gas emissions (UN, 2020). The transportation sector is the leading one in forming greenhouse gases in cities. One-fifth of global greenhouse gas emissions originate from the transport sector. Transport emissions account for 24% of energy sector emissions (Our World in Data, 2020). Cities that have gained awareness of this issue are producing strategies with new zoning laws to reduce air pollution. The beginning of these strategies is promoting bicycle use and pedestrianization projects. But it remains to be seen whether walking or biking in polluted cities will increase exposure to airborne pollutants, negating the health benefits of exercise. Magda Cepeda and colleagues in The Lancet Public Health reported that 71% of commuters were exposed to all pollutants more than active travelers. Most importantly, commuters lost up to 1 year of life expectancy compared to cyclists (Landrigan, 2017).
The most crucial step in reducing air pollution is to monitor air pollutants in the atmosphere.
So what is the impact of this air pollution mitigation strategy?
Air pollution is not local; it is an environmental problem that has the potential to affect other regions with the prevailing wind. Studies show that air pollution is transboundary ecological pollution and even affects wild animals living in the poles (Orhan, 2012). Air Pollution Monitoring Networks are an essential communication key, providing the public with locally relevant information about air quality in real time. Increasing the public’s access to environmental information is one of the significant responsibilities of the state.
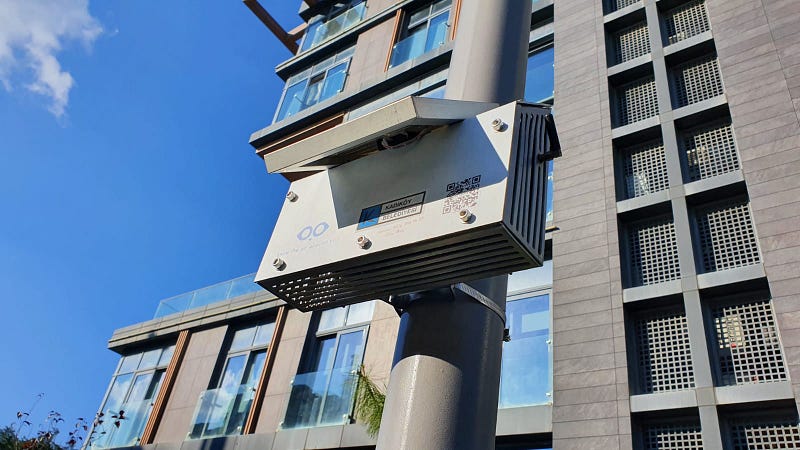
Beijing
Public concern about worsening air pollution in China, which has a large share of the world’s greenhouse gas emissions, has been increasing since 1990. In 2013, the concentration of PM2.5 in Beijing, the country’s capital, was seventeen times the amount considered safe by the World Health Organization (WHO). More than two million premature deaths annually are attributed to China’s outdoor and indoor air pollution. Nevertheless, the country, which has prepared a National Air Quality Action Plan to combat air pollution, has reduced PM2.5 pollution by 39.5 percent in eight years (2013–2020) with its targets (AQLI, 2018).
The government’s strategies to achieve its target of reducing annual PM2.5 levels in Beijing included:
- Banning new coal-fired power plants,
- Increasing renewable energy production,
- Reducing iron and steel production capacity in the industry,
- Better enforce emissions standards, and
- Increasing transparency in government reporting of air quality statistics.
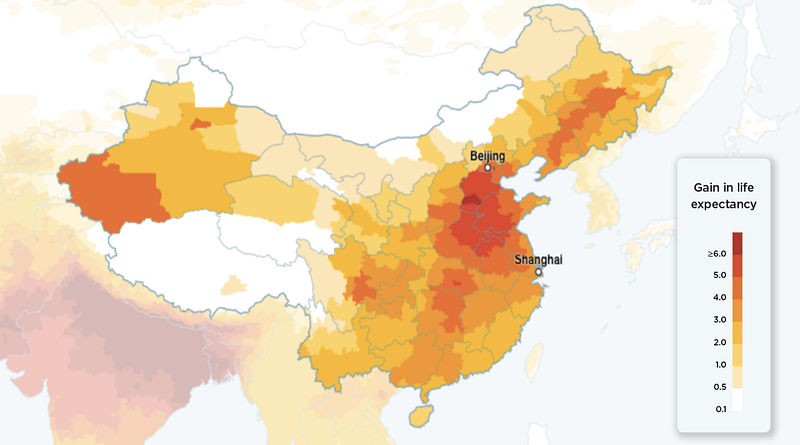
The most significant impact in reducing air pollution is without a doubt; in 2007, Ma Jun, director of China’s path-breaking environmental NGO, the Institute of Public & Environmental Affairs, released the China Air Pollution Map, a tool that allowed users to view air quality data from around the country (AQLI, 2018).
London
London’s fight against air pollution has been going on since the 17th century. By the 20th century, the fog in London began to be considered one of the characteristic features of the city and even found a place in literature. The country’s government began to enact laws to combat air pollution, which became a severe problem in the 1960s (EEA, 2021). The most important cause of air pollution in London is vehicles dependent on fossil fuels, and these vehicles are the first in the city’s fight against air pollution. London has been working on this struggle for years. With the Ultra Low Emission Zone (ULEZ) application, which started in 2018, the carbon emissions of transportation on the streets decreased by 6%, and the NO2 intensity decreased by 44% (Climate Newspaper, 2021). However, if emissions have reduced significantly, London still experiences high exposure to PM.
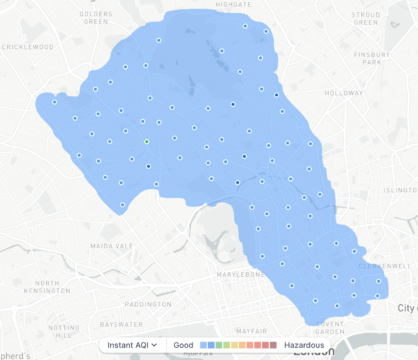
An air quality sensors network project was launched with environmental technology firm Airscape in 2021 in London’s Camden district. Over 225 sensors have been installed on utility poles and buildings across the county to capture and report ‘hyper-local data’ every minute and map pollution in real-time. The data is publicly available at Airscape’s address, where pollution levels from individual sensors can be viewed. Unfortunately, since the sensors were installed, the overall air quality index (AQI) for the county is currently showing as “unhealthy” (Cities Today, 2022). This shows that studies to reduce air pollution in London are insufficient, and more effective mitigation strategies must be implemented.
Research shows that we are insufficient in the fight against air pollution. While developed countries are making more progress in the fight against air pollution, developing and underdeveloped countries cannot fight against air pollution and cause more environmental problems.
Thanks to the developing technology, it is possible to create air pollution monitoring networks with air sensors at low-cost today. Underdeveloped and developing countries can detect pollution sources by increasing the spatial coverage in air monitoring networks through weather sensors and creating air pollution reduction strategies. Cities that produce the necessary reduction strategies in this regard, especially in Europe, have the opportunity to measure the impact of the reduction projects with sensors. In addition to monitoring air quality management, it is necessary to understand how the effect of actions is beneficial in achieving the goals set.
References
Air Quality Life Index (AQLI), 2018. https://aqli.epic.uchicago.edu/policy-impacts/china-national-air-quality-action-plan-2014/
Cities Today, 2022. https://cities-today.com/london-borough-launches-hyper-local-air-quality-sensor-network/
Climate Newspaper, 2021. https://iklimgazetesi.com/londranin-hava-kirliligiyle-mucadelesinde-ultra-dusuk-emisyon-bolgeleri/
European Environment Agency (EEA), 2021. https://www.eea.europa.eu/signals/signals-2013/articles/europes-air-today
Greenpeace, 2021. https://www.greenpeace.org/static/planet4-turkey-stateless/2021/04/be0661a7-okul-bolgeleri-hava-kirliligi-raporu-greenpeace-2021.pdf
Landrigan, P. J. (2017). Air pollution and health. The Lancet Public Health, 2(1), e4-e5.
Orhan, G. (2012). Air Pollution and Acıd Rains: Turkey’s Position Against The Long-Range Cross-Border Air Pollution Convention And Protocols. Marmara University European Community Institute Journal of European Studies, 20(1), 123–150.
Our World in Data, 2020.https://ourworldindata.org/co2-emissions-from-transport
United Nations (UN), 2020. https://www.un.org/en/climatechange/climate-solutions/cities-pollution#:~:text=Cities%20are%20major%20contributors%20to,cent%20of%20the%20Earth’s%20surface.
World Health Organization (WHO), 2022. https://www.who.int/news/item/07-09-2022-who-releases-new-repository-of-resources-for-air-quality-management


